

Here at Neuroskeptic we have closely followed the development of fMRI scanning on fish.
But a new study has taken it to the next level by scanning... some cheese.
OK, this is not quite true. The study used NMR spectroscopy to analyze the chemistry of some cheeses, in order to measure the effects of different kinds of probiotic bacteria on the composition of the cheese. NMR is the same technology as MRI, and indeed you can use an MRI scanner to gather NMR spectra.
In fact, NMR is Nuclear Magnetic Resonance and MRI is Magnetic Resonance Imaging; it was originally called NMRI, but they dropped the "N" because people didn't like the idea of being scanned by a "nuclear" machine. However, this study didn't actually involve putting cheese into an MRI scanner.
But the important point is that they could have done it by doing that. And if you did that, what with the salmon and now the cheese, you could get a nice MRI-based meal going. All we need is for someone to scan some vegetables, some herbs, and a slice of lemon, and we'd have a delicious dataset. Mmm.
How to cook it? Well, it's actually possible to heat stuff up with an MRI scanner. When scanning people, you set it up to make sure this doesn't happen, but the average fMRI experiment still causes mild heating. It's unavoidable.
I'm not sure what the maximum possible heating effect of an average MRI scanner would be. I doubt anyone has gone out of their way to try and maximize it, but maybe someone ought to look into it. Think of the possibilites.
You've just finished a hard day's scanning and you're really hungry, but the microwave at the MRI building is broken. Not to worry! Just pop your fillet of salmon in probiotic cheese sauce in the magnet, and scan it 'till it's done. You could inspect the images and the chemical composition of the meal before you eat it, to make sure it's just right.
Just make sure you don't use a steel saucepan...
First Fish, Now Cheese, Get Scanned
 01.15
01.15
 wsn
wsn
The Tufnel Effect
00.11
wsn

In This Is Spin̈al Tap, British heavy metal god Nigel Tufnel says, in reference to one of his band's less succesful creations:
It's such a fine line between stupid and...uh, clever.This is all too true when it comes to science. You can design a breathtakingly clever experiment, using state of the art methods to address a really interesting and important question. And then at the end you realize that you forgot to type one word when writing the 1,000 lines of software code that runs this whole thing, and as a result, the whole thing's a bust.
It happens all too often. It has happened to me, let me think, three times in my scientific career and, I know of several colleagues who had similar problems and I'm currently struggling to deal with the consequences of someone else's stupid mistake.
Here's my cautionary tale. I once ran an experiment involving giving people a drug or placebo and when I crunched the numbers I found, or thought I'd found, a really interesting effect which was consistent with a lot of previous work giving this drug to animals. How cool is that?
So I set about writing it up and told my supervisor and all my colleagues. Awesome.
About two or three months later, for some reason I decided to reopen the data file, which was in Microsoft Excel, to look something up. I happened to notice something rather odd - one of the experimental subjects, who I remembered by name, was listed with a date-of-birth which seemed wrong: they weren't nearly that old.
Slightly confused - but not worried yet - I looked at all the other names and dates of birth and, oh dear, they were all wrong. But why?
Then it dawned on me and now I was worried: the dates were all correct but they were lined up with the wrong names. In an instant I saw the horrible possibility: m ixed up names would be harmless in themselves but what if the group assignments (1 = drug, 0 = placebo) were lined up with the wrong results? That would render the whole analysis invalid... and oh dear. They were.
As the temperature of my blood plummeted I got up and lurched over to my filing cabinet where the raw data was stored on paper. It was deceptively easy to correct the mix-up and put the data back together. I re-ran the analysis.
No drug effect.
I checked it over and over. Everything was completely watertight - now. I went home. I didn't eat and I didn't sleep much. The next morning I broke the news to my supervisor. Writing that email was one of the hardest things I've ever done.
What happened? As mentioned I had been doing all the analysis in Excel. Excel is not a bad stats package and it's very easy to use but the problem is that it's too easy: it just does whatever you tell it to do, even if this is stupid.
In my data as in most people's, each row was one sample (i.e. a person) and each column was a piece of info. What happened was that I'd tried to take all the data, which was in no particular order, and reorder the rows alphabetically by subject name to make it easier to read.
How could I screw that up? Well, by trying to select "all the data" but actually only selecting a few of the columns. Then I reordered them, but not the others, so all the rows became mixed up. And the crucial column, drug=1 placebo=0, was one of the ones I reordered.
The immediate lesson I learned from this was: don't use Excel, use SPSS, which simply does not allow you to reorder only some of the data. Actually, I still use Excel for making graphs and figures but every time I use it, I think back to that terrible day.
The broader lesson though is that if you're doing something which involves 100 steps, it only takes 1 mistake to render the other 99 irrelevant. This is true in all fields but I think it's especially bad in science, because mistakes can so easily go unnoticed due to the complexity of the data, and the consequences are severe because of the long time-scale of scientific projects.

Here's what I've learned: Look at your data, every step of the way, and look at your methods, every time you use them. If you're doing a neuroimaging study, the first thing you do after you collect the brain scans is to open them up and just look at them. Do they look sensible?
Analyze your data as you go along. Every time some new results come in, put it into your data table and just look at it. Make a graph which just shows absolutely every number all on one massive, meaningless line from Age to Cigarette's Smoked Per Week to EEG Alpha Frequency At Time 58. For every subject. Get to know the data. That way if something weird happens to it, you'll know. Don't wait to the end of the study to do the analysis. And don't rely on just your own judgement - show your data to other experts.
Check and recheck your methods as you go along. If you're running, say, a psychological experiment involving showing people pictures and getting them to push buttons, put yourself in the hot seat and try it on yourself. Not just once, but over and over. Some of the most insidious problems with these kinds of studies will go unnoticed if you only look at the task once - such as the old "randomized"-stimuli-that-aren't-random issue.
Trust no-one. This sounds bad, but it's not. Don't rely on their work, in experimental design or data analysis, until you've checked it yourself. This doesn't mean you're assuming they're stupid, because everyone makes these mistakes. It just means you're assuming they're human like you.
Finally, if the worst happens and you discover a stupid mistake in your own work: admit it. It feels like the end of the world when this happens, but it's not. However, if you don't admit it, or even worse, start fiddling other results to cover it up - that's misconduct, and if you get caught doing that, it is the end of the world, or your career, at any rate.
 Posted in
fMRI,
methods,
science,
statistics
Posted in
fMRI,
methods,
science,
statistics
fMRI Scanning Salmon - Seriously.
08.12
wsn
Back in 2009, a crack team of neuroscientists led by Craig Bennett (blog) famously put a dead fish into an MRI scanner and showed it some pictures.
They found some blobs of activation - when they used an inappropriately lenient statistical method. Their point, of course, was to draw attention to the fact that you really shouldn't use that method for fMRI. You can read the whole paper here. The Atlantic Salmon who heroically volunteered for the study was no more than a prop. In fact, I believe he ended up getting eaten.
But now, a Japanese team have just published a serious paper which actually used fMRI to measure brain activity in some salmon: Olfactory Responses to Natal Stream Water in Sockeye Salmon by BOLD fMRI.
How do you scan a fish? Well, like this: A total of 6 fish were scanned. The salmon were immobilized by adding an anaesthetic (eugenol) and a muscle relaxant (gallamine) to their tank of water. Then, they were carefully clamped into place to make sure they really wouldn't move, while a stream of oxygenated water was pumped through their tank.
Apart from that, it was pretty much a routine fMRI scan.
Why would you want to scan a fish? This is where the serious science comes in. Salmon are born in rivers but they swim out to live in the ocean once they reach maturity. However, they return to the river to breed. What's amazing is that salmon will return to the same river that they were born in - even if they have to travel thousands of miles to get there.
How they manage this is unclear, but the smell (or maybe taste) of the water from their birth river has long been known to be crucial at least once they've reached the right general area (see here for a good overview). Every river contains a unique mixture of chemicals, both natural and artificial (pollutants). Salmon seem to be attracted to whatever chemicals were present in the water when they were young.
In this study, the fMRI revealed that relative to pure water, home-stream water activated a part of the salmon's telencephalon - the most "advanced" part (in humans, it constitutes the vast majority of the brain; in fish, it's tiny). By contrast, a control scent (the amino acid L-serine) did not activate this area, even though the concentration of L-serine was far higher than that of anything in the home-stream water. How this happens is unclear, but further studies of the identified telencephalon area ought to shed more light on it.
So fishMRI is clearly a fast-developing area of neuroscience. In fact, as this graph shows, it's enjoying exponential growth and, if current trends continue, could become almost as popular as scanning people... Link: Also blogged at NeuroDojo.
Bandoh H, Kida I, & Ueda H (2011). Olfactory Responses to Natal Stream Water in Sockeye Salmon by BOLD fMRI. PloS one, 6 (1) PMID: 21264223When "Healthy Brains" Aren't
09.45
wsn
There's a lot of talk, much of it rather speculative, about "neuroethics" nowadays. But there's one all too real ethical dilemma, a direct consequence of modern neuroscience, that gets very little attention. This is the problem of incidental findings on MRI scans.
An "incidental finding" is when you scan someone's brain for research purposes, and, unexpectedly, notice that something looks wrong with it. This is surprisingly common: estimates range from 2–8% of the general population. It will happen to you if you regularly use MRI or fMRI for research purposes, and when it does, it's a shock. Especially when the brain in question belongs to someone you know. Friends, family and colleagues are often the first to be recruited for MRI studies.
This is why it's vital to have a system in place for dealing with incidental findings. Any responsible MRI scanning centre will have one, and as a researcher you ought to be familiar with it. But what system is best?
Broadly speaking there are two extreme positions:
- Research scans are not designed for diagnosis, and 99% of MRI researchers are not qualified to make a diagnosis. What looks "abnormal" to Joe Neuroscientist BSc or even Dr Bob Psychiatrist is rarely a sign of illness, and likewise they can easily miss real diseases. So, we should ignore incidental findings, pretend the scan never happened, because for all clinical purposes, it didn't.
- You have to do whatever you can with an incidental finding. You have the scans, like it or not, and if you ignore them, you're putting lives at risk. No, they're not clinical scans, they can still detect many diseases. So all scans should be examined by a qualified neuroradiologist, and any abnormalities which are possibly pathological should be followed-up.
Most places adopt a middle-of-the-road approach. Scans aren't routinely checked by an expert, but if a researcher spots something weird, they can refer the scan to a qualified clinician to follow up. Almost always, there's no underlying disease. Even large, OMG-he-has-a-golf-ball-in-his-brain findings can be benign. But not always.
This is fine but it doesn't always work smoothly. The details are everything. Who's the go-to expert for your study, and what are their professional obligations? Are they checking your scan "in a personal capacity", or is this a formal clinical referral? What's their e-mail address? What format should you send the file in? If they're on holiday, who's the backup? At what point should you inform the volunteer about what's happening?
Like fire escapes, these things are incredibly boring, until the day when they're suddenly not.
A new paper from the University of California Irvine describes a computerized system that made it easy for researchers to refer scans to a neuroradiologist. A secure website was set up and publicized in University neuroscience community.
Suspect scans could be uploaded, in one of two common formats. They were then anonymized and automatically forwarded to the Department of Radiology for an expert opinion. Email notifications kept everyone up to date with the progress of each scan.
This seems like a very good idea, partially because of the technical advantages, but also because of the "placebo effect" - the fact that there's an electronic system in place sends the message: we're serious about this, please use this system.
Out about 5,000 research scans over 5 years, there were 27 referrals. Most were deemed benign... except one which turned out to be potentially very serious - suspected hydrocephalus, increased fluid pressure in the brain, which prompted an urgent referral to hospital for further tests.
 There's no ideal solution to the problem of incidental findings, because by their very nature, research scans are kind of clinical and kind of not. But this system seems as good as any.Cramer SC, Wu J, Hanson JA, Nouri S, Karnani D, Chuang TM, & Le V (2011). A system for addressing incidental findings in neuroimaging research. NeuroImage PMID: 21224007 Posted in
ethics,
fMRI,
methods,
papers,
philosophy
There's no ideal solution to the problem of incidental findings, because by their very nature, research scans are kind of clinical and kind of not. But this system seems as good as any.Cramer SC, Wu J, Hanson JA, Nouri S, Karnani D, Chuang TM, & Le V (2011). A system for addressing incidental findings in neuroimaging research. NeuroImage PMID: 21224007 Posted in
ethics,
fMRI,
methods,
papers,
philosophy
Massive Magnets Reveal More Sex In the Brain
04.46
wsn
 Metzger CD, Eckert U, Steiner J, Sartorius A, Buchmann JE, Stadler J, Tempelmann C, Speck O, Bogerts B, Abler B, & Walter M (2010). High field FMRI reveals thalamocortical integration of segregated cognitive and emotional processing in mediodorsal and intralaminar thalamic nuclei. Frontiers in neuroanatomy, 4 PMID: 21088699
England Rules the (Brain) Waves
14.20
wsn
 Yes, England has finally won something. After a poor showing in the 2010 World Cup, the Eurovision Song Contest, and the global economic crisis, we're officially #1 in neuroscience. Which clearly is the most important measure of a nation's success.
According to data collated by ScienceWatch.com and released recently, each English neuroscience paper from the past 10 years has been cited, on average, 24.53 times, making us the most cited country in the world relative to the total number of papers published (source here). We're second only to the USA in terms of overall citations.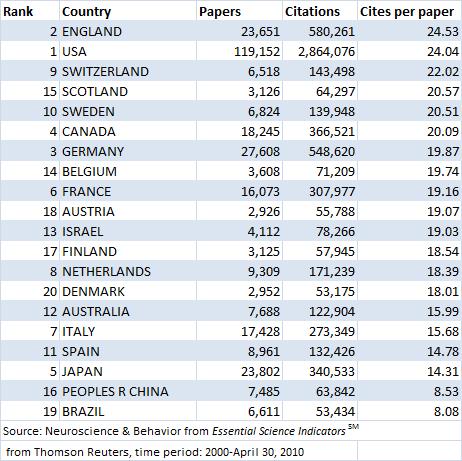 (In this table, "Rank" refers to total number of citations).
Why is this? I suspect it owes a lot to the fact that England has produced many of the technical papers which everyone refers to (although few people have ever read). Take the paper Dynamic Causal Modelling by Karl Friston et al from London. It's been cited 649 times since 2003, because it's the standard reference for the increasingly popular fMRI technique of the same name.
Or take Ashburner and Friston's Voxel-Based Morphometry—The Methods, cited over 2000 times in the past 10 years, which introduced a method for measuring the size of different brain regions. Or take...most of Karl Friston's papers, actually. He's the single biggest contributor to the way in which modern neuroimaging is done.
You're (Brain Is) So Immature
06.30
wsn
How mature are you? Have you ever wanted to find out, with a 5 minute brain scan? Of course you have. And now you can, thanks to a new Science paper, Prediction of Individual Brain Maturity Using fMRI. This is another clever application of the support vector machine (SVM) method, which I've written about previously, most recently regarding "the brain scan to diagnose autism". An SVM is a machine learning algorithm: give it a bunch of data, and it'll find patterns in it.
In this case, the input data was brain scans from children, teenagers and adults, and the corresponding ages of each brain. The pattern the SVM was asked to find was the relationship between age and some complex set of parameters about the brain.
The scan was resting state functional connectivity fMRI. This measures the degree to which different areas of the brain tend to activate or deactivate together while you're just lying there (hence "resting"). A high connectivity between two regions means that they're probably "talking to each other", although not necessarily directly.
It worked fairly well: Out of 238 people aged 7 to 30, the SVM was able to "predict" age pretty nicely on the basis of the resting state scan. This graph shows chronological age against predicted brain age (or "fcMI" as they call it). The correlation is strong: r2=0.55.
The authors then tested it on two other large datasets: one was resting state, but conducted on a less powerful scanner (1.5T vs 3.0T) (n=195), and the other was not designed as a resting state scan at all, but did happen to include some resting state-like data (n=186). Despite the fact that these data were, therefore, very different to the original dataset, the SVM was able to predict age with r2 over 0.5 as well.
What use would this be? Well, good question. It would be all too easy to, say, find a scan of your colleague's brain, run it through the Mature-O-Meter, and announce with glee that they have a neurological age of 12, which explains a lot. For example.
However, while this would be funny, it wouldn't necessarily tell you anything about them. We already know everyone's neurological age. It's... their age. Your brain is an old as you are. These data raise the interesting possibility that people with a higher Maturity Index, for their age, are actually more "mature" people, whatever that means. But that might not be true at all. We'll have to wait and see.
How does this help us to understand the brain? An SVM is an incredibly powerful mathematical tool for detecting non-linear correlations in complex data. But just running an SVM on some data doesn't mean we've learned anything: only the SVM has. It's a machine learning algorithm, that's what it does. There's a risk that we'll get "science without understanding" as I've written a while back.
In fact the authors did make a start on this and the results were pretty neat. They found that as the brain matures, long-range functional connections within the brain become stronger, but short-range interactions between neighbours get weaker and this local disconnection with age is the most reliable change.
 You can see this on the pic above: long connections get stronger (orange) while short ones get weaker (green), in general. This is true all across the brain.
It's like how when you're a kid, you play with the kids next door, but when you grow up you spend all your time on the internet talking to people thousands of miles away, and never speak to your neighbours. Kind of.
Link: Also blogged about here.
Dosenbach NU, Nardos B, Cohen AL, Fair DA, Power JD, Church JA, Nelson SM, Wig GS, Vogel AC, Lessov-Schlaggar CN, Barnes KA, Dubis JW, Feczko E, Coalson RS, Pruett JR Jr, Barch DM, Petersen SE, & Schlaggar BL (2010). Prediction of individual brain maturity using fMRI. Science (New York, N.Y.), 329 (5997), 1358-61 PMID: 20829489 Posted in
fMRI,
methods,
neurofetish,
papers
fMRI Analysis in 1000 Words
04.45
wsn
Following on from fMRI in 1000 words, which seemed to go down well, here's the next step: how to analyze the data.
There are many software packages available for fMRI analysis, such as FSL, SPM, AFNI, and BrainVoyager. The following principles, however, apply to most. The first step is pre-processing, which involves:
- Motion Correction aka Realignment – during the course of the experiment subjects often move their heads slightly; during realignment, all of the volumes are automatically adjusted to eliminate motion.
- Smoothing – all MRI signals contain some degree of random noise. During smoothing, the image of the whole brain is blurred. This tends to smooth out random fluctuations. The degree of smoothing is given by the “Full Width to Half Maximum” (FWHM) of the smoother. Between 5 and 8 mm is most common.
- Spatial Normalization aka Warping – Everyone’s brain has a unique shape and size. In order to compare activations between two or more people, you need to eliminate these differences. Each subject’s brain is warped so that it fits with a standard template (the Montreal Neurological Institute or MNI template is most popular.)
Then the real fun begins: the stats. By far the most common statistical approach for detecting task-related neural activation is that based upon the General Linear Model (GLM), though there are alternatives.
We first need to define a model of what responses we’re looking for, which makes predictions as to what the neural signal should look like. The simplest model would be that the brain is more active at certain times, say, when a picture is on the screen. So our model would be simply a record of when the stimulus was on the screen. This is called a "boxcar" function (guess why):
 In fact, we know that the neural response has a certain time lag. So we can improve our model by adding the canonical (meaning “standard”) haemodynamic response function (HRF).
 Now consider a single voxel. The MRI signal in this voxel (the brightness) varies over time. If there were no particular neural activation in this area, we’d expect the variation to be purely noise:
 Now suppose that this voxel was responding to a stimulus present from time-point 40 to 80.
While the signal is on average higher during this period of activation, there’s still a lot of noise, so the data doesn’t fit with the model exactly.
 The GLM is a way of asking, for each voxel, how closely it fits a particular model. It estimates a parameter, β, representing the “goodness-of-fit” of the model at that voxel, relative to noise. Higher β, better fit. Note that a model could be more complex than the one above. For example, we could have two kinds of pictures, Faces and Houses, presented on the screen at different times:
 In this case, we are estimating two β scores for each voxel, β-faces and β-houses. Each stimulus type is called an explanatory variable (EV). But how do we decide which β scores are high enough to qualify as “activations”? Just by chance, some voxels which contain pure noise will have quite high β scores (even a stopped clock’s right twice per day!)
The answer is to calculate the t score, which for each voxel is β / standard deviation of β across the whole brain. The higher the t score, the more unlikely it is that the model would fit that well by chance alone. It’s conventional to finally convert the t score into the closely-related z score.
We therefore end up with a map of the brain in terms of z. z is a statistical parameter, so fMRI analysis is a form of statistical parametric mapping (even if you don’t use the "SPM" software!) Higher z scores mean more likely activation.
Note also that we are often interested in the difference or contrast between two EVs. For example, we might be interested in areas that respond to Faces more than Houses. In this case, rather than comparing β scores to zero, we compare them to each other – but we still end up with a z score. In fact, even an analysis with just one EV is still a contrast: it’s a contrast between the EV, and an “implicit baseline”, which is that nothing happens.
Now we still need to decide how high of a z score we consider “high enough”, in other words we need to set a threshold. We could use conventional criteria for significance: p less than 0.05. But there are 10,000 voxels in a typical fMRI scan, so that would leave us with 500 false positives.
We could go for a p value 10,000 times smaller, but that would be too conservative. Luckily, real brain activations tend to happen in clusters of connected voxels, especially when you’ve smoothed the data, and clusters are unlikely to occur due to chance. So the solution is to threshold clusters, not voxels.
A typical threshold would be “z greater than 2.3, p less than 0.05”, meaning that you're searching for clusters of voxels, all of which has a z score of at least 2.3, where there's only a 5% chance of finding a cluster that size by chance (based on this theory.) This is called a cluster corrected analysis. Not everyone uses cluster correction, but they should. This is what happens if you don't.
Thus, after all that, we hopefully get some nice colorful blobs for each subject, each blob representing a cluster and colour representing voxel z scores:
 This is called a first-level, or single-subject, analysis. Comparing the activations across multiple subjects is called the second-level or group-level analysis, and it relies on similar principles to find clusters which significantly activate across most people.
This discussion has focused on the most common method of model-based detection of activations. There are other "data driven" or "model free" approaches, such as this. There are also ways of analyzing fMRI data to find connections and patterns rather than just activations. But that's another story...
Posted in
bad neuroscience,
fMRI,
methods
Real Time fMRI
12.33
wsn
Wouldn't it be cool if you could measure brain activation with fMRI... right as it happens? You could lie there in the scanner and watch your brain light up. Then you could watch your brain light up some more in response to seeing your brain light up, and watch it light up even more upon seeing your brain light up in response to seeing itself light up... like putting your brain between two mirrors and getting an infinite tunnel of activations.
Ok, that would probably get boring, eventually. But there'd be some useful applications too. Apart from the obvious research interest, it would allow you to attempt fMRI neurofeedback: training yourself to be able to activate or deactivate parts of your brain. Neurofeedback has a long (and controversial) history, but so far it's only been feasible using EEG because that's the only neuroimaging method that gives real-time results. EEG is unfortunately not very good at localizing activity to specific areas.
Now MIT neuroscientists Hinds et al present a new way of doing right-now fMRI:
Essentially the approach is closely related to standard fMRI analysis processes, except instead of waiting for all of the data to come in before starting to analyze it, it incrementally estimates neural activation every time a new scan of the brain arrives, while accounting for various forms of noise.
 They first show that it works well on some simulated data, and then discuss the results of a real experiment in which 16 people were asked to alternately increase or decrease their own neural response to hearing the noise of the MRI scanner (they are very noisy). Neurofeedback was given by showing them a "thermometer" representing activity in their auditory cortex.
The real-time estimates of activation turned out to be highly correlated with the estimates given by conventional analysis after the experiment was over - though we're not told how well people were able to use the neurofeedback to regulate their own brains.
Unfortunately, we're not given all of the technical details of the method, so you won't be able to jump into the nearest scanner and look into your brain quite yet, though they do promise that "this method will be made publicly available as part of a real-time functional imaging software package."
Hinds, O., Ghosh, S., Thompson, T., Yoo, J., Whitfield-Gabrieli, S., Triantafyllou, C., & Gabrieli, J. (2010). Computing moment to moment BOLD activation for real-time neurofeedback NeuroImage DOI: 10.1016/j.neuroimage.2010.07.060The A Team Sets fMRI to Rights
00.55
wsn
Remember the voodoo correlations and double-dipping controversies that rocked the world of fMRI last year? Well, the guys responsible have teamed up and written a new paper together. They are... The paper is Everything you never wanted to know about circular analysis, but were afraid to ask. Our all-star team of voodoo-hunters - including Ed "Hannibal" Vul (now styled Professor Vul), Nikolaus "Howling Mad" Kriegeskorte, and Russell "B. A." Poldrack - provide a good overview of the various issues and offer their opinions on how the field should move forward.
The fuss concerns a statistical trap that it's easy for neuroimaging researchers, and certain other scientists, to fall into. Suppose you have a large set of data - like a scan of the brain, which is a set of perhaps 40,000 little cubes called voxels - and you search it for data points where there is a statistically significant effect of some kind.
Because you're searching in so many places, in order to avoid getting lots of false positives you set the threshold for significance very high. That's fine in itself, but a problem arises if you find some significant effects and then take those significant data points and use them as a measure of the size of the effects - because you have specifically selected your data points on the basis that they show the very biggest effects out of all your data. This is called the non-independence error and it can make small effects seem much bigger.
The latest paper offers little that's new in terms of theory, but it's a good read and it's interesting to get the authors' expert opinion on some hot topics. Here's what they have to say about the question of whether it's acceptable to present results that suffer from the non-independence error just to "illustrate" your statistically valid findings:
Q: Are visualizations of non-independent data helpful to illustrate the claims of a paper?Now an awful lot of people - and I confess that I've been among them - do this without the appropriate disclaimers. Indeed, it is routine. Why? Because it can be useful illustration - although the size of the effects appears to be inflated in such graphs, on a qualitative level they provide a useful impression of the direction and nature of the effects.
A: Although helpful for exploration and story telling, circular data plots are misleading when presented as though they constitute empirical evidence unaffected by selection. Disclaimers and graphical indications of circularity should accompany such visualizations.
But the A Team are right. Such figures are misleading - they mislead about the size of the effect, even if only inadvertently. We should use disclaimers, or ideally, avoid using misleading graphs. Of course, this is a self-appointed committee: no-one has to listen to them. We really should though, because what they're saying is common sense once you understand the issues.
It's really not that scary - as I said on this blog at the outset, this is not going to bring the whole of fMRI crashing down and end everyone's careers; it's a technical issue, but it is a serious one, and we have no excuse for not dealing with it.
Kriegeskorte, N., Lindquist, M., Nichols, T., Poldrack, R., & Vul, E. (2010). Everything you never wanted to know about circular analysis, but were afraid to ask Journal of Cerebral Blood Flow & Metabolism DOI: 10.1038/jcbfm.2010.86 Posted in
bad neuroscience,
fMRI,
methods,
papers,
voodoo
fMRI In 1000 Words
06.48
wsn
I thought I'd write a short and simple intro to how fMRI works. Most such explanations start with the physics of Magnetic Resonance Imaging and eventually explain how it lets you look at brain activity. I'm doing it the other way round, because I like brains more than physics.
So - everyone knows that fMRI is a way of measuring neural activation. But what does it mean for a neuron to be active? All brain cells are "active": they're alive, firing electrical action potentials, and sending out neurotransmitters to other cells at synapses. If a certain cell gets more activated, that means that it's firing action potentials faster, or sending out more chemical signals. It's mostly synaptic activity which fMRI picks up.
How do you measure neural activation? You can do it directly by sticking in an electrode to measure action potentials, or use a glass tube to measure neurotransmitter levels. You can put electrodes on the scalp to pick up the electrical fields created by lots of neurons firing. But fMRI relies on an indirect approach: when a brain cell is firing hard, it uses more energy than when it's not.
Cells make energy from sugar and oxygen; oxygen is transported in the blood. So when a given cell is working hard, it uses more oxygen, and the oxygen content of nearby blood falls. Synaptic activity, in particular, uses loads of oxygen. So you might expect that highly active parts of the brain would have less oxygen. Counter-intuitively, they actually show an increase in blood oxygen, which is probably a kind of "overcompensation" for the activity (although there may be an "initial dip" in oxygen, it's very brief.)
So blood oxygen is a proxy for activation. How do you measure it? Oxygen in blood binds to haemoglobin, a protein that contains iron (which is why blood is red, like rust, and tastes metallic...like iron). By a nice coincidence, haemoglobin with oxygen is red; haemoglobin without oxygen is blueish or purple. This is why your veins, containing deoxygenated blood, are blue and why you turn blue if you're suffocating.
You could measure neural activity by literally looking to see how red the brain is. This is actually possible, but obviously it's a bit impractical. Luckily, as well as being blue, deoxygenated haemoglobin acts as a magnet. So blood is magnetic, and the strength of its magnetic field depends on how oxygenated it is. That's really useful, but how do you measure those magnetic fields?
Using an extremely strong magnet - like the liquid-helium-cooled superconducting coil at the heart of every MRI scanner, for example - you can make some of the protons in the body align in a special way. If you then fire some radio waves at these aligned protons, they can absorb them ("resonate"). As soon as you stop the radio waves, they'll release them back at you, like an echo - which is why the most common form of fMRI scan is called Echo-Planar Imaging (EPI). All matter contains protons; in the human body, most of them are found in water.
Each proton only responds to a specific frequency of radio waves. This frequency is determined by the strength of the magnetic field in which it sits - stronger fields, higher frequencies. Crucially, the magnetic fields surrounding deoxygenated blood therefore shift the radio frequency at which nearby protons respond. Suppose a certain bit of the brain resonates at frequency X. If some deoxygenated blood appears nearby, it will stop them from responding to that frequency - by making them respond to a different one.
fMRI is essentially a way of measuring the degree to which protons in each part of the brain don't respond at the "expected" resonant frequency X, due to interference from nearby deoxygenated haemoglobin. But how do you know what resonant frequency to expect? This is the clever bit: simply by varying the magnetic field across different parts of the brain.
Say you make the magnetic field at the left side of the head slightly stronger than the one at the right - a magnetic gradient. The resonant frequency will therefore vary across the head: the further left, the higher the frequency. This is what the "gradient coils" in an MRI machine do. Gradient coils therefore translate spatial location into magnetic field strength. And as we know, magnetic field strength = resonant frequency. So spatial location = magnetic field strength = resonant frequency. All you then need to do is to hit the brain with a burst of radio waves of all different frequencies - a kind of white noise called the "RF Pulse" - and record the waves you get back.
The strength of the radio waves at a given frequency therefore corresponds to the amount of protons in the appropriate place - so you can work out the density of matter in the brain based on the frequencies you get. Also, different kinds of tissues in the body respond differently to excitation; bone responds differently to brain grey matter, for example. So you can build up an image of brain structure by using magnetic gradients.
Of course you can't scan the whole brain at once: you scan it in slices, divided up into roughly cubic units called voxels. Typically in fMRI these are 3x3x3 mm or so, but they can be much smaller for specialized applications. The smaller the voxels, the longer the scan takes because it requires more gradient shifting. The loud noises that occur during MRI scans are caused by the gradient coils changing the gradients extremely quickly in order to scan the whole brain. Modern scanners typically image the whole brain once every 3 seconds, but you can go even faster.
As we've seen, deoxygenated blood degrades the image nearby, in what's called the Blood Oxygenation Level Dependent (BOLD) response. Neural activation increases oxygen and literally makes the brain light up; you could, in theory, see the changes with the naked eye. In fact, they're tiny, and there is always a lot of background noise as well, so you need statistical analysis to determine which parts light up, and then map this onto the brain as colored blobs. But that's another story...
New, Voodoo-Free fMRI Technique
08.25
wsn
MIT brain scanners Fedorenko et al present A new method for fMRI investigations of language: Defining ROIs functionally in individual subjects. Also on the list of authors is Nancy Kanwisher, one of the feared fMRI voodoo correlations posse. The paper describes a technique for mapping out the "language areas" of the brain in individual people, not for their own sake, but as a way of improving other fMRI studies of language. That's important because while everyone's brain is organized roughly the same way, there are always individual differences in the shape, size and location of the different regions.
This is a problem for fMRI researchers. Suppose you scan 10 people and show them pictures of apples and pictures of pears. And suppose that apples activate the brain's Fruit Cortex much more strongly than pears. But unfortunately, the Fruit Cortex is a small area, and its location varies between people. In fact, in your 10 subjects, no-one's Fruit Cortex overlaps with anyone else's, even though everyone has one and they all work exactly the same way.
If you did this experiment you'd fail to find the effect of apples vs. pears, even though it's a strong effect, because there will be no one place in the brain where apples reliably cause more activation. What you need is a way of finding the Fruit Cortex in each person beforehand. What you'd need to do is a functional localization scan - say, showing people a big bowl of fruit - as a preliminary step.
Fedorenko et al scanned a bunch of people while doing a simple reading task, and compared that to a control condition, reading a random list of nonsense which makes no linguistic sense. As you can see, there's a lot of variation between people, but there's also clearly a basic pattern of activation: it looks a bit like a tilted "V" on the left side of the brain: These are the language areas of each person. (Incidentally, this is why fMRI, despite its limitations, is an amazing technology. There is no better way of measuring this activation. EEG is cheaper but nowhere near as good at localizing activity; PET is close, but it's slow, expensive and involves injecting people with radioactivity.)
Fedorenko et al then overlapped all the individual images to produce of map of the brain showing how many people got activation in each part: The most robust activations were on the left side of the brain, and they formed a nice "V" shape again. These are the areas which have long been known to be involved in language, so this is not surprising in itself.
Here's the clever bit: they then took the areas activated in a large % of people, and automatically divided them up into sub-regions; each of the "peaks" where an especially large proportion of subjects showed activation became a separate region.
This is on the assumption that these peaks represent parts of the brain with distinct functions - separate "language modules" as it were. But each module will be in a slightly different place in each person (see the first picture). So they overlapped the subdivisions with the individual activation blobs to get a set of individual functional zones they call Group-constrained Subject-Specific functional Regions of Interest, or GcSSfROIs to their friends. Fedorenko et al claim various advantages to this technique, and present data showing that it produces nice results in independent subjects (i.e. not the ones they used to make the group map in the first place.)
In particular, they argue that it should allow future fMRI studies to have a better chance of finding the specific functions of each region. So far, experiments using fMRI to investigate language have largely failed to find activations specific to particular aspects of language like grammar, word meaning, etc. which is unexpected because patients suffering lesions to specific areas often do show very selective language problems.
Does this relate to the voodoo correlations issue? Indirectly, yes. The voodoo (non-independence error) problem arises when you do a large number of comparisons, and then focus on the "best" results, because these are likely to be wholly, or partially, only that good by chance.
Fedorenko et al's method allows you to avoid doing lots of comparisons in the first place. Instead of looking all over the whole brain for something interesting, you can first do a preliminary scan to map out where in each person's brain interesting stuff is likely to happen, and then focus on those bits in the real experiment.
There's still a multiple-comparisons problem: Fedorenko et al identified 16 candidate language areas per brain, and future studies could well provide more. But that's nothing compared to the 40,000 voxels in a typical whole-brain analysis. We'll have to wait and see if this technique proves useful in the real world, but it's an interesting idea...
Posted in
fMRI,
methods,
papers,
statistics,
voodoo
Can We Rely on fMRI?
14.10
wsn
Craig Bennett (of Prefrontal.org) and Michael Miller, of dead fish brain scan fame, have a new paper out: How reliable are the results from functional magnetic resonance imaging?
Tal over at the [citation needed] blog has an excellent in-depth discussion of the paper, and Mind Hacks has a good summary, but here's my take on what it all means in practical terms.
Suppose you scan someone's brain while they're looking at a picture of a cat. You find that certain parts of their brain are activated to a certain degree by looking at the cat, compared to when they're just lying there with no picture. You happily publish your results as showing The Neural Correlates of Cat Perception.
If you then scanned that person again while they were looking at the same cat, you'd presumably hope that exact same parts of the brain would light up to the same degree as they did the first time. After all, you claim to have found The Neural Correlates of Cat Perception, not just any old random junk.
If you did find a perfect overlap in the area and the degree of activation that would be an example of 100% test-retest reliability. In their paper, Bennett and Miller review the evidence on the test-retest reliability of fMRI studies. They found 63 of them. On average, they found that the reliability of fMRI falls quite far short of perfection: the areas activated (clusters) had a mean Dice overlap of 0.476, while the strength of activation was correlated with a mean ICC of 0.50.
But those numbers, taken out of context, do not mean very much. Indeed, what is a Dice overlap? You'll have to read the whole paper to find out, but even when you do, they still don't mean that much. I suspect this is why Bennett and Miller don't mention them in the Abstract of the paper, and in fact they don't spend more than a few lines discussing them at all.
A Dice overlap of 0.476 and an ICC of 0.50 are what you get if average over all of the studies that anyone's done looking at the test-retest reliability of any particular fMRI experiment. But different fMRI experiments have different reliabilities. Saying that the average reliability of fMRI is 0.5 is rather like saying that the mean velocity of a human being is 0.3 km per hour. That's probably about right, averaging over everyone in the world, including those who are asleep in bed and those who are flying on airplanes - but it's not very useful. Some people are moving faster than others, and some scans are more reliable than others.
Most of this paper is not concerned with "how reliable fMRI is", but rather, with how to make any given scanning experiment more reliable. And this is an important thing to write about, because even the most optimistic cognitive neuroscientist would agree that many fMRI results are not especially reliable, and as Bennett and Miller say, reliability matters for lots of reasons:
Scientific truth. While it is a simple statement that can be taken straight out of an undergraduate research methods course, an important point must be made about reliability in research studies: it is the foundation on which scientific knowledge is based. Without reliable, reproducible results no study can effectively contribute to scientific knowledge.... if a researcher obtains a different set of results today than they did yesterday, what has really been discovered?So what determines the reliability of any given fMRI study? Lots of things. Some of them are inherent to the nature of the brain, and are not really things we can change: activation in response to basic perceptual and motor tasks is probably always going to be more reliable than activation related to "higher" functions like emotions.
Clinical and Diagnostic Applications. The longitudinal assessment of changes in regional brain activity is becoming increasingly important for the diagnosis and treatment of clinical disorders...
Evidentiary Applications. The results from functional imaging are increasingly being submitted as evidence into the United States legal system...
Scientific Collaboration. A final pragmatic dimension of fMRI reliability is the ability to share data between researchers...
But there are lots of things we can change. Although it's rarely obvious from the final results, researchers make dozens of choices when designing and analyzing an fMRI experiment, many of which can at least potentially have a big impact on the reliability of their findings. Bennett and Miller cover lots of them:
voxel size... repetition time (TR), echo time (TE), bandwidth, slice gap, and k-space trajectory... spatial realignment of the EPI data can have a dramatic effect on lowering movement-related variance ... Recent algorithms can also help remove remaining signal variability due to magnetic susceptibility induced by movement... simply increasing the number of fMRI runs improved the reliability of their results from ICC = 0.26 to ICC = 0.58. That is quite a large jump for an additional ten or fifteen minutes of scanning...The details get extremely technical, but then, when you do an fMRI scan you're using a superconducting magnet to image human neural activity by measuring the quantum spin properties of protons. It doesn't get much more technical.
Perhaps the central problem with modern neuroimaging research is that it's all too easy for researchers to write off the important experimental design issues as "merely" technicalities, and just put some people in a scanner using the default scan sequence and see what happens. This is something few fMRI users are entirely innocent of, and I'm certainly not, but it is a serious problem. As Bennett and Miller point out, the devil is in the technical details.
The generation of highly reliable results requires that sources of error be minimized across a wide array of factors. An issue within any single factor can significantly reduce reliability. Problems with the scanner, a poorly designed task, or an improper analysis method could each be extremely detrimental. Conversely, elimination of all such issues is necessary for high reliability. A well maintained scanner, well designed tasks, and effective analysis techniques are all prerequisites for reliable results.
Bennett CM, Miller MB. (2010). How reliable are the results from functional magnetic resonance imaging? Annals of the New York Academy of Sciences Posted in
bad neuroscience,
fMRI,
methods,
papers,
statistics,
voodoo
Good News for Armchair Neuropathologists
15.05
wsn
 Ever wanted to crack the mysteries of the brain? Dreamed of discovering the cause of mental illness?
Well, now, you can - or, at any rate, you can try - and you can do it from the comfort of your own home, thanks to the new Stanley Neuropathology Consortium Integrative Database.
Just register (it's free and instant) and you get access to a pool of data derived from the Stanley Neuropathology Consortium brain collection. The collection comprises 60 frozen brains - 15 each from people with schizophrenia, bipolar disorder, and clinical depression, and 15 "normals".
In a Neuropsychopharmacology paper announcing the project, administrators Sanghyeon Kim and Maree Webster point out that
Data sharing has become more important than ever in the biomedical sciences with the advance of high-throughput technology and web-based databases are one of the most efficient available resources to share datasets.The Institute's 60 brains have long been the leading source of human brain tissue for researchers in biological psychiatry. Whenever you read about a new discovery relating to schizophrenia or bipolar disorder, chances are the Stanley brains were involved. The Institute provide slices of the brains free of charge to scientists who request them, and they've sent out over 200,000 to date.
Until now, if you wanted to find out what these scientists discovered about the brains, you'd have to look up the results in the many hundreds of scientific papers where the various results were published. If you knew where to look, and if you had a lot of time on your hands. The database collates all of the findings. That's a good idea. To ensure that they get all of the results, the Institute have another good idea:
Coded specimens are sent to researchers with the code varying from researcher to researcher to ensure that all studies are blinded. The code is released to the researcher only when the data have been collected and submitted to the Institute.
 The data we're provided about the brains is quite exciting, if you like molecules, comprising 1749 markers from 12 different parts of the brain. Markers include levels of proteins, RNA, and the number and shape of various types of cells.
It's easy to use. While waiting for my coffee to brew, I compared the amount of the protein GFAP76 in the frontal cortex between the four groups. There was no significant difference. I guess GFAP76 doesn't cause mental illness - darn. So much for my Nobel Prize winning theory. But I did find that levels of GFAP76 were very strongly correlated with levels of another protein, "phosphirylated" (I think they mean "phosphorylated") PRKCA. You read it here first.
In the paper, Kim and Webster used the Database to find many differences between normal brains and diseased brains, including increased levels of dopamine in schizophrenia, and increased levels of glutamate in depression and bipolar. And decreased GAD67 proteins in the frontal cortex in bipolar and schizophrenia. And decreased reelin mRNA in the frontal cortex and cerebellum in bipolar and schizophrenia. And...
This leaves open the vital questions of what these differences mean, as I have complained before. And the problem with giving everyone in the world the results of 1749 different tests, and letting us cross-correlate them with each other and look for differences between 4 patient groups, is that you're making possible an awful lot of comparisons. With only 15 brains per group, none of the results can be considered anything more than provisional, anyway - what we really need are lots more brains.
But this database is still a welcome move. This kind of data pooling is the only sensible approach to doing modern science, and it's something people are advocating in other fields of neuroscience as well. It just makes sense to share results rather than leaving everyone to do there own thing in near-isolation from each other, now that we have the technology to do so. In fact, I'd say it's a... no-brainer.
Kim, S., & Webster, M. (2009). The Stanley Neuropathology Consortium Integrative Database: a Novel, Web-Based Tool for Exploring Neuropathological Markers in Psychiatric Disorders and the Biological Processes Associated with Abnormalities of Those Markers Neuropsychopharmacology, 35 (2), 473-482 DOI: 10.1038/npp.2009.151 Posted in
blogging,
genes,
mental health,
methods,
papers,
schizophrenia


