

Here at Neuroskeptic we have closely followed the development of fMRI scanning on fish.
But a new study has taken it to the next level by scanning... some cheese.
OK, this is not quite true. The study used NMR spectroscopy to analyze the chemistry of some cheeses, in order to measure the effects of different kinds of probiotic bacteria on the composition of the cheese. NMR is the same technology as MRI, and indeed you can use an MRI scanner to gather NMR spectra.
In fact, NMR is Nuclear Magnetic Resonance and MRI is Magnetic Resonance Imaging; it was originally called NMRI, but they dropped the "N" because people didn't like the idea of being scanned by a "nuclear" machine. However, this study didn't actually involve putting cheese into an MRI scanner.
But the important point is that they could have done it by doing that. And if you did that, what with the salmon and now the cheese, you could get a nice MRI-based meal going. All we need is for someone to scan some vegetables, some herbs, and a slice of lemon, and we'd have a delicious dataset. Mmm.
How to cook it? Well, it's actually possible to heat stuff up with an MRI scanner. When scanning people, you set it up to make sure this doesn't happen, but the average fMRI experiment still causes mild heating. It's unavoidable.
I'm not sure what the maximum possible heating effect of an average MRI scanner would be. I doubt anyone has gone out of their way to try and maximize it, but maybe someone ought to look into it. Think of the possibilites.
You've just finished a hard day's scanning and you're really hungry, but the microwave at the MRI building is broken. Not to worry! Just pop your fillet of salmon in probiotic cheese sauce in the magnet, and scan it 'till it's done. You could inspect the images and the chemical composition of the meal before you eat it, to make sure it's just right.
Just make sure you don't use a steel saucepan...![]() Rodrigues D, Santos CH, Rocha-Santos TA, Gomes AM, Goodfellow BJ, & Freitas AC (2011). Metabolic Profiling of Potential Probiotic or Synbiotic Cheeses by Nuclear Magnetic Resonance (NMR) Spectroscopy. Journal of agricultural and food chemistry PMID: 21443163
Rodrigues D, Santos CH, Rocha-Santos TA, Gomes AM, Goodfellow BJ, & Freitas AC (2011). Metabolic Profiling of Potential Probiotic or Synbiotic Cheeses by Nuclear Magnetic Resonance (NMR) Spectroscopy. Journal of agricultural and food chemistry PMID: 21443163
First Fish, Now Cheese, Get Scanned
 01.15
01.15
 wsn
wsn
The Tufnel Effect
00.11
wsn

In This Is Spin̈al Tap, British heavy metal god Nigel Tufnel says, in reference to one of his band's less succesful creations:
It's such a fine line between stupid and...uh, clever.This is all too true when it comes to science. You can design a breathtakingly clever experiment, using state of the art methods to address a really interesting and important question. And then at the end you realize that you forgot to type one word when writing the 1,000 lines of software code that runs this whole thing, and as a result, the whole thing's a bust.
It happens all too often. It has happened to me, let me think, three times in my scientific career and, I know of several colleagues who had similar problems and I'm currently struggling to deal with the consequences of someone else's stupid mistake.
Here's my cautionary tale. I once ran an experiment involving giving people a drug or placebo and when I crunched the numbers I found, or thought I'd found, a really interesting effect which was consistent with a lot of previous work giving this drug to animals. How cool is that?
So I set about writing it up and told my supervisor and all my colleagues. Awesome.
About two or three months later, for some reason I decided to reopen the data file, which was in Microsoft Excel, to look something up. I happened to notice something rather odd - one of the experimental subjects, who I remembered by name, was listed with a date-of-birth which seemed wrong: they weren't nearly that old.
Slightly confused - but not worried yet - I looked at all the other names and dates of birth and, oh dear, they were all wrong. But why?
Then it dawned on me and now I was worried: the dates were all correct but they were lined up with the wrong names. In an instant I saw the horrible possibility: m ixed up names would be harmless in themselves but what if the group assignments (1 = drug, 0 = placebo) were lined up with the wrong results? That would render the whole analysis invalid... and oh dear. They were.
As the temperature of my blood plummeted I got up and lurched over to my filing cabinet where the raw data was stored on paper. It was deceptively easy to correct the mix-up and put the data back together. I re-ran the analysis.
No drug effect.
I checked it over and over. Everything was completely watertight - now. I went home. I didn't eat and I didn't sleep much. The next morning I broke the news to my supervisor. Writing that email was one of the hardest things I've ever done.
What happened? As mentioned I had been doing all the analysis in Excel. Excel is not a bad stats package and it's very easy to use but the problem is that it's too easy: it just does whatever you tell it to do, even if this is stupid.
In my data as in most people's, each row was one sample (i.e. a person) and each column was a piece of info. What happened was that I'd tried to take all the data, which was in no particular order, and reorder the rows alphabetically by subject name to make it easier to read.
How could I screw that up? Well, by trying to select "all the data" but actually only selecting a few of the columns. Then I reordered them, but not the others, so all the rows became mixed up. And the crucial column, drug=1 placebo=0, was one of the ones I reordered.
The immediate lesson I learned from this was: don't use Excel, use SPSS, which simply does not allow you to reorder only some of the data. Actually, I still use Excel for making graphs and figures but every time I use it, I think back to that terrible day.
The broader lesson though is that if you're doing something which involves 100 steps, it only takes 1 mistake to render the other 99 irrelevant. This is true in all fields but I think it's especially bad in science, because mistakes can so easily go unnoticed due to the complexity of the data, and the consequences are severe because of the long time-scale of scientific projects.

Here's what I've learned: Look at your data, every step of the way, and look at your methods, every time you use them. If you're doing a neuroimaging study, the first thing you do after you collect the brain scans is to open them up and just look at them. Do they look sensible?
Analyze your data as you go along. Every time some new results come in, put it into your data table and just look at it. Make a graph which just shows absolutely every number all on one massive, meaningless line from Age to Cigarette's Smoked Per Week to EEG Alpha Frequency At Time 58. For every subject. Get to know the data. That way if something weird happens to it, you'll know. Don't wait to the end of the study to do the analysis. And don't rely on just your own judgement - show your data to other experts.
Check and recheck your methods as you go along. If you're running, say, a psychological experiment involving showing people pictures and getting them to push buttons, put yourself in the hot seat and try it on yourself. Not just once, but over and over. Some of the most insidious problems with these kinds of studies will go unnoticed if you only look at the task once - such as the old "randomized"-stimuli-that-aren't-random issue.
Trust no-one. This sounds bad, but it's not. Don't rely on their work, in experimental design or data analysis, until you've checked it yourself. This doesn't mean you're assuming they're stupid, because everyone makes these mistakes. It just means you're assuming they're human like you.
Finally, if the worst happens and you discover a stupid mistake in your own work: admit it. It feels like the end of the world when this happens, but it's not. However, if you don't admit it, or even worse, start fiddling other results to cover it up - that's misconduct, and if you get caught doing that, it is the end of the world, or your career, at any rate.
 Posted in
fMRI,
methods,
science,
statistics
Posted in
fMRI,
methods,
science,
statistics
Women Are Better Connected... Neurally
23.50
wsn
The search for differences between the brains of men and women has a long and rather confusing history. Any structural differences are small, and their significance is controversial. The one rock-solid finding is that men's brains are slightly bigger on average. Then again, men are slightly bigger on average in general.
A new paper just out from Tomasi and Volkow (of cell-phones-affect-brain fame) offers, on the face of it, extremely strong evidence for a gender difference in the brain, not in structure but in function: Gender Differences in Brain Functional Connectivity Density.
Here's the headline pic: They used resting-state "functional connectivity" (though see here for why this term may be misleading) fMRI in men and women. This essentially means that they put people in the MRI scanner, told them to just lie there and relax, and measured the degree to which activity in different parts of the brain was correlated to activity in every other part. They had a whopping 561 brains in total, though they didn't scan everyone themselves: they downloaded the data from here.
As you can see the results were highly consistent around the world. In both men and women, the main "connectivity hub" was an area called the ventral precuneus. This is interesting in itself although not a new finding as the precuneus has long been known to be involved in resting-state networks. However, the degree of connectivity was higher in women than in men 14% higher, in fact.
The method they used, which they've dubbed "Local Functional Connectivity Density Mapping", is apparantly a fast way of calculating the degree to which each part of the brain is functionally related to each other part.
You could do this by taking every single voxel and correlating it with every other voxel, for every single person, but this would take forever unless you had a supercomputer. LFCDM is, they say, a short-cut. I'm not really qualified to judge whether it's a valid one, but it looks solid.
Also, men's brains were on average bigger, but interestingly they show that women had, relative to brain size, more grey matter than men. Here's the data (I'm not sure about the color scheme...) So what does the functional connectivity finding mean? It could mean anything, or nothing. You could interpret the highly interconnected female brain as an explanation for why women are more holistic, better at multi-tasking, and more in touch with their emotions than men with their fragmented faculties. Or whatever.
Or you could say, that that's sexist rubbish, and all this means is that men and women on average are thinking about different things when they lie in MRI scanners. We already know that resting-state functional connectivity centred on the precuneus is suppressed whenever your attention is directed towards an external "task".
That's not a fault of this research, which is excellent as far as it goes and certainly raises lots of interesting questions about functional connectivity. But we don't know what it means quite yet.![]() Tomasi D, & Volkow ND (2011). Gender differences in brain functional connectivity density. Human brain mapping PMID: 21425398
Tomasi D, & Volkow ND (2011). Gender differences in brain functional connectivity density. Human brain mapping PMID: 21425398
Posted in
fMRI,
neurofetish,
papers
The Brain's Sarcasm Centre? Wow, That's Really Useful
12.25
wsn
A team of Japanese scientists have found the most sarcastic part of the brain known to date. They also found the metaphor centre of the brain and, well, it's kind of like a pair of glasses. The paper is Distinction between the literal and intended meanings of sentences and it's brought to you by Uchiyama et al. They took 20 people and used fMRI to record neural activity while the volunteers read 4 kinds of statements:
- Literally true
- Nonsensical
- Sarcastic
- Metaphorical
Here's what they found. Compared to the literally-true and the nonsensical statements, which were a control condition, metaphorical statements activated the head of the caudate nucleus, the thalamus, and an area of the medial PFC they dub the "arMPFC" but which other people might call the pgACC or something even more exotic; names get a bit vague in the frontal lobe.

The caudate nucleus, as I said, looks like a pair of glasses. Except without the nose bit. The area activated by metaphors was the "lenses". Kind of.
Sarcasm however activated the same mPFC region, but not the caudate:
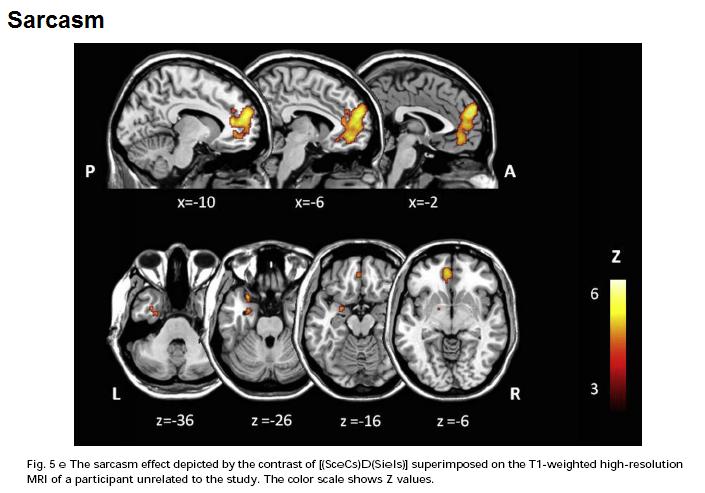 Sarcasm also activated the amygdala.
But what can this kind of study tell us about the brain? They've localized something-about-metaphor to the caudate nucleus, but what is it, and what does the caudate actually do to make that thing happen?
The authors offer a suggestion - the caudate is involved in "searching for the meaning" of the metaphorical statement in order to link it to the context, and work out what the metaphor is getting at. This isn't required for sarcasm because there's only one, literal, meaning - it's just reversed, the speaker actually thinks the exact opposite. Whereas with both sarcasm and metaphor you need to attribute intentions (mentalizing or "Theory of Mind").
That's as plausible an account as any but the problem is that we have no way of knowing, at least not from imaging studies, if it's true or not. As I said this is not the fault of this study but rather an inherent challenge for the whole enterprise. The problem is - switch on your caudate, metaphor coming up - a lot like the challenge facing biology in the aftermath of the Human Genome Project.
The HGP mapped the human genome, and like any map it told us where stuff is, in this case where genes are on chromosomes. You can browse it here. But by itself this didn't tell us anything about biology. We still have to work out what most of these genes actually do; and then we have to work out how they interact; and they we have to work out how those interactions interact with other genes and the environment...
Genomics people call this, broadly speaking, "annotating" the genome, although this is not perhaps an ideal term because it's not merely scribbling notes in the margins, it's the key to understanding. Without annotation, the genome's just a big list.
fMRI is building up a kind of human localization map, a blobome if you will, but by itself this doesn't really tell us much; other tools are required.
Antidepressants Don't Work...In Fish
13.10
wsn
Here at Neuroskeptic fMRI scanning and antidepressants are both big topics.
As I discussed lask week, fish - specifically salmon - are the next big thing in fMRI and the number of salmon brains being scanned is growing at a remarkable rate. But fish haven't made much of an entrance into the world of antidepressants...until now.
Swedish scientists Holmberg et al have just published a paper asking: Does waterborne citalopram affect the aggressive and sexual behaviour of rainbow trout and guppy?
SSRI antidepressants, of which citalopram is one, are very popular. So popular, in fact, that non-trivial levels of SSRIs have been found in sewage and there's a concern that they might make their way into lakes and rivers and thereby affect the behaviour of the animals living there.
Holmberg et al set out to see what citalopram did to some fish in an attempt to find out whether this is likely to be a major problem. So they put some citalopram in the fish's water supplies and then tested their aggressiveness and also their sex drives. It turns out that one of the main ways of measure fish aggression is to put a mirror in their tank and see if they try to fight their own reflection. Fish are not very bright, really.
Anyway, the good news for fish everywhere was that seven days of citalopram exposure had no effect at all, even at doses much higher than those reported as a pollutant (the maximum dose was 0.1 mg/l). And the authors had no conflicts of interest: Big Pharma had nothing to do with this research, although Big Fish Farmer did because they bought the fish from one.
However, this may not be the end of the story, because it turned out that citalopram was very poorly absorbed into the fish's bloodstreams. But other antidepressants have been reported to accumulate in fish. Clearly, the only way to find out for sure what's going on would be to use fMRI...![]() Holmberg A, Fogel J, Albertsson E, Fick J, Brown JN, Paxéus N, Förlin L, Johnsson JI, & Larsson DG (2011). Does waterborne citalopram affect the aggressive and sexual behaviour of rainbow trout and guppy? Journal of hazardous materials PMID: 21300431
Holmberg A, Fogel J, Albertsson E, Fick J, Brown JN, Paxéus N, Förlin L, Johnsson JI, & Larsson DG (2011). Does waterborne citalopram affect the aggressive and sexual behaviour of rainbow trout and guppy? Journal of hazardous materials PMID: 21300431
Posted in
animals,
antidepressants,
drugs,
fMRI,
funny,
mental health,
papers
fMRI Scanning Salmon - Seriously.
08.12
wsn
Back in 2009, a crack team of neuroscientists led by Craig Bennett (blog) famously put a dead fish into an MRI scanner and showed it some pictures.
They found some blobs of activation - when they used an inappropriately lenient statistical method. Their point, of course, was to draw attention to the fact that you really shouldn't use that method for fMRI. You can read the whole paper here. The Atlantic Salmon who heroically volunteered for the study was no more than a prop. In fact, I believe he ended up getting eaten.
But now, a Japanese team have just published a serious paper which actually used fMRI to measure brain activity in some salmon: Olfactory Responses to Natal Stream Water in Sockeye Salmon by BOLD fMRI.
How do you scan a fish? Well, like this: A total of 6 fish were scanned. The salmon were immobilized by adding an anaesthetic (eugenol) and a muscle relaxant (gallamine) to their tank of water. Then, they were carefully clamped into place to make sure they really wouldn't move, while a stream of oxygenated water was pumped through their tank.
Apart from that, it was pretty much a routine fMRI scan.
Why would you want to scan a fish? This is where the serious science comes in. Salmon are born in rivers but they swim out to live in the ocean once they reach maturity. However, they return to the river to breed. What's amazing is that salmon will return to the same river that they were born in - even if they have to travel thousands of miles to get there.
How they manage this is unclear, but the smell (or maybe taste) of the water from their birth river has long been known to be crucial at least once they've reached the right general area (see here for a good overview). Every river contains a unique mixture of chemicals, both natural and artificial (pollutants). Salmon seem to be attracted to whatever chemicals were present in the water when they were young.
In this study, the fMRI revealed that relative to pure water, home-stream water activated a part of the salmon's telencephalon - the most "advanced" part (in humans, it constitutes the vast majority of the brain; in fish, it's tiny). By contrast, a control scent (the amino acid L-serine) did not activate this area, even though the concentration of L-serine was far higher than that of anything in the home-stream water. How this happens is unclear, but further studies of the identified telencephalon area ought to shed more light on it.
So fishMRI is clearly a fast-developing area of neuroscience. In fact, as this graph shows, it's enjoying exponential growth and, if current trends continue, could become almost as popular as scanning people... Link: Also blogged at NeuroDojo.
When "Healthy Brains" Aren't
09.45
wsn
There's a lot of talk, much of it rather speculative, about "neuroethics" nowadays. But there's one all too real ethical dilemma, a direct consequence of modern neuroscience, that gets very little attention. This is the problem of incidental findings on MRI scans.
An "incidental finding" is when you scan someone's brain for research purposes, and, unexpectedly, notice that something looks wrong with it. This is surprisingly common: estimates range from 2–8% of the general population. It will happen to you if you regularly use MRI or fMRI for research purposes, and when it does, it's a shock. Especially when the brain in question belongs to someone you know. Friends, family and colleagues are often the first to be recruited for MRI studies.
This is why it's vital to have a system in place for dealing with incidental findings. Any responsible MRI scanning centre will have one, and as a researcher you ought to be familiar with it. But what system is best?
Broadly speaking there are two extreme positions:
- Research scans are not designed for diagnosis, and 99% of MRI researchers are not qualified to make a diagnosis. What looks "abnormal" to Joe Neuroscientist BSc or even Dr Bob Psychiatrist is rarely a sign of illness, and likewise they can easily miss real diseases. So, we should ignore incidental findings, pretend the scan never happened, because for all clinical purposes, it didn't.
- You have to do whatever you can with an incidental finding. You have the scans, like it or not, and if you ignore them, you're putting lives at risk. No, they're not clinical scans, they can still detect many diseases. So all scans should be examined by a qualified neuroradiologist, and any abnormalities which are possibly pathological should be followed-up.
Most places adopt a middle-of-the-road approach. Scans aren't routinely checked by an expert, but if a researcher spots something weird, they can refer the scan to a qualified clinician to follow up. Almost always, there's no underlying disease. Even large, OMG-he-has-a-golf-ball-in-his-brain findings can be benign. But not always.
This is fine but it doesn't always work smoothly. The details are everything. Who's the go-to expert for your study, and what are their professional obligations? Are they checking your scan "in a personal capacity", or is this a formal clinical referral? What's their e-mail address? What format should you send the file in? If they're on holiday, who's the backup? At what point should you inform the volunteer about what's happening?
Like fire escapes, these things are incredibly boring, until the day when they're suddenly not.
A new paper from the University of California Irvine describes a computerized system that made it easy for researchers to refer scans to a neuroradiologist. A secure website was set up and publicized in University neuroscience community.
Suspect scans could be uploaded, in one of two common formats. They were then anonymized and automatically forwarded to the Department of Radiology for an expert opinion. Email notifications kept everyone up to date with the progress of each scan.
This seems like a very good idea, partially because of the technical advantages, but also because of the "placebo effect" - the fact that there's an electronic system in place sends the message: we're serious about this, please use this system.
Out about 5,000 research scans over 5 years, there were 27 referrals. Most were deemed benign... except one which turned out to be potentially very serious - suspected hydrocephalus, increased fluid pressure in the brain, which prompted an urgent referral to hospital for further tests.
 There's no ideal solution to the problem of incidental findings, because by their very nature, research scans are kind of clinical and kind of not. But this system seems as good as any. Posted in
ethics,
fMRI,
methods,
papers,
philosophy
There's no ideal solution to the problem of incidental findings, because by their very nature, research scans are kind of clinical and kind of not. But this system seems as good as any. Posted in
ethics,
fMRI,
methods,
papers,
philosophy
The Scanner's Prayer
05.30
wsn
MRI scanners have revolutionized medicine and provided neuroscientists with some incredible tools for exploring the brain. But that doesn't mean they're fun to use. They can be annoying, unpredictable beings, and you never know whether they're going to bless you with nice results or curse you with cancelled scans and noisy data.
So for the benefit of everyone who has to work with MRI, here is a devotional litany which might just keep your scanner from getting wrathful at the crucial moment. Say this before each scan. Just remember, the magnet is always on and it can read your mind, so make sure you really mean it, and refrain from scientific sins...
Our scanner, which art from Siemens,
Hallowed be thy coils.
Thy data come;
Thy scans be done;
In grey matter as it is in white matter.
Give us this day our daily blobs.
And forgive us our trespasses,
As we forgive them that trespass onto our scan slots.
And lead us not into the magnet room carrying a pair of scissors,
But deliver us from volunteers who can’t keep their heads still.
For thine is the magnet,
The gradients,
And the headcoil,
For ever and ever (at least until we can afford a 7T).
Amen.
(Apologies to Christians).
The Time Travelling Brain
14.10
wsn
What's the difference between walking down the street yesterday, and walking down the street tomorrow? It's nothing to do with the walking, or the street: that's the same. When seems to be something external to the what, how, and where of the situation. But this creates a problem for neuroscientists.
We think we know how the fact that the brain could store the concept of "walking down the street" (or "walking" and "street"). Very roughly, simple sensory impressions are thought to get built up into more and more complex combinations, and this happens as you move away from the brain's primary visual cortex (V1) and down the so-called ventral visual stream.
In area V1, cells respond mostly to nothing more complex than position and the orientations of straight lines: / or \ or _ , etc. Whereas once you get to the temporal lobe, far down the stream, you have cells that respond to Jennifer Aniston. In between are progressively more complex collections of features.
Even if the details are wrong, the fact that complex objects are composed of simpler parts and ultimately raw sensations, means that our ability to process complex scenes doesn't seem too mysterious, given that we have senses.
But the fact that we can take any given scene, and effortlessly think of it as either "past", "present", or "future", is puzzling under this view because, as I said, the scene itself is the same in all cases. And it's not as if we have a sense devoted to time: the only time we're ever directly aware of, is "right now".
Swedish neuroscientists Nyberg et al used fMRI to measure brain activity associated with "mental time travel": Consciousness of subjective time in the brain. They scanned volunteers and asked them imagine walking between two points, in 4 different situations: past, present, future, or remembered (as opposed to imagined in the past). This short walk was one which they'd really done, many times.
What happened? Compared to a control task of doing mental arithmetic, both remembering and imagining the walk activated numerous brain areas and there was very strong overlap between the two conditions. No big surprise there.
The crucial contrast was between remembering, past imagining and future imagining, vs. imagining in the present. This revealed a rather cute little blob: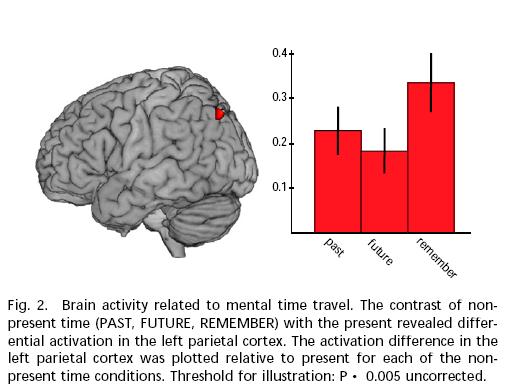 This small nugget of the left parietal cortex represents an area where the brain is more active when thinking about times other than the present, relative to thinking about the same thing, but right now. They note that this area "partly overlaps a left angular region shown to be recruited during both past and future thinking and with parietal regions implicated in self-projection in past, present, or future time."
So what? This is a nice study, but like most fMRI it doesn't tell us what this area is actually doing. To know that, we'd need to know what would happen to someone if that area were damaged. Would they be unable to imagine any time except the present? Would they think their memories were happening right now? Maybe you could use rTMS could temporarily inactivate it - if you could find volunteers willing to lose their sense of time for a while...![]() Nyberg L, Kim AS, Habib R, Levine B, & Tulving E (2010). Consciousness of subjective time in the brain. Proceedings of the National Academy of Sciences of the United States of America PMID: 21135219
Nyberg L, Kim AS, Habib R, Levine B, & Tulving E (2010). Consciousness of subjective time in the brain. Proceedings of the National Academy of Sciences of the United States of America PMID: 21135219
Posted in
fMRI,
papers,
philosophy
How To Fool A Lie Detector Brain Scan
13.40
wsn
Can fMRI scans be used to detect deception? It would be nice, although a little scary, if they could. And there have been several reports of succesful trials under laboratory conditions. However, a new paper in Neuroimage reveals an easy way of tricking the technology: Lying In The Scanner.
The authors used a variant of the "guilty knowledge test" which was originally developed for use with EEG. Essentially, you show the subject a series of pictures or other stimui, one of which is somehow special; maybe it's a picture of the murder weapon or something else which a guilty person would recognise, but the innocent would not.
You then try to work out whether the subject's brain responds differently to the special target stimulus as opposed to all the other irrelevant ones. In this study, the stimuli were dates, and for the "guilty" volunteers, the "murder weapon" was their own birthday, a date which obviously has a lot of significance for them. For the "innocent" people, all the dates were random.
What happened? The scans were extremely good at telling the "guilty" from the "innocent" people - it managed a 100% accuracy with no false positive or false negatives. The image above shows the activation associated with the target stimulus (birthdays) over and above the control stimuli. In two seperate groups of volunteers, the blobs were extremely similar. So the technique does work in principle, which is nice.
But the countermeasures fooled it entirely, reducing accuracy to well below random chance. And the countermeasures were very simple: before the scan, subjects were taught to associate an action, a tiny movement of one of their fingers or toes, with some of the "irrelevant" dates. This, of course, made these dates personally relevant, just like the really relevant stimuli, so there was no difference between them, making the "guilty" appear "innocent".
Maybe it'll be possible in the future to tell the difference between brain responses to really significant stimuli as opposed to artifical ones, or at least, to work out whether or not someone is using this trick. Presumably, if there's a neural signiture for guilty knowledge, there's also one for trying to game the system. But as it stands, this is yet more evidence that lie detection using fMRI is by no means ready for use in the real world just yet...![]() Ganis G, Rosenfeld JP, Meixner J, Kievit RA, & Schendan HE (2010). Lying in the scanner: Covert countermeasures disrupt deception detection by functional magnetic resonance imaging. NeuroImage PMID: 21111834
Ganis G, Rosenfeld JP, Meixner J, Kievit RA, & Schendan HE (2010). Lying in the scanner: Covert countermeasures disrupt deception detection by functional magnetic resonance imaging. NeuroImage PMID: 21111834
Posted in
bad neuroscience,
fMRI,
law,
papers
Massive Magnets Reveal More Sex In the Brain
04.46
wsn

England Rules the (Brain) Waves
14.20
wsn
 Yes, England has finally won something. After a poor showing in the 2010 World Cup, the Eurovision Song Contest, and the global economic crisis, we're officially #1 in neuroscience. Which clearly is the most important measure of a nation's success.
According to data collated by ScienceWatch.com and released recently, each English neuroscience paper from the past 10 years has been cited, on average, 24.53 times, making us the most cited country in the world relative to the total number of papers published (source here). We're second only to the USA in terms of overall citations.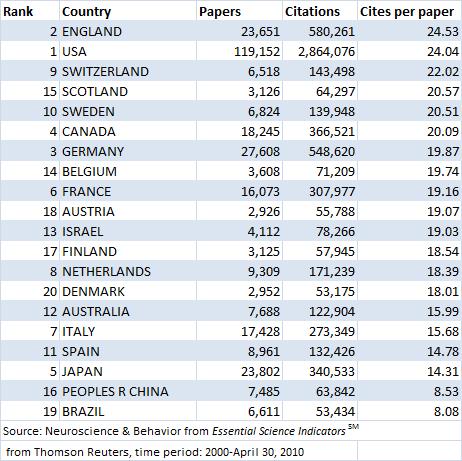 (In this table, "Rank" refers to total number of citations).
Why is this? I suspect it owes a lot to the fact that England has produced many of the technical papers which everyone refers to (although few people have ever read). Take the paper Dynamic Causal Modelling by Karl Friston et al from London. It's been cited 649 times since 2003, because it's the standard reference for the increasingly popular fMRI technique of the same name.
Or take Ashburner and Friston's Voxel-Based Morphometry—The Methods, cited over 2000 times in the past 10 years, which introduced a method for measuring the size of different brain regions. Or take...most of Karl Friston's papers, actually. He's the single biggest contributor to the way in which modern neuroimaging is done.
Brain Scans Prove That The Brain Does Stuff
14.01
wsn
The US scientists behind the study suggest it provides solid evidence that the problem can have a physical origin. According to the BBC (and many others)...
Libido problems 'brain not mind'
The research in question (which hasn't been published yet) has been covered very well over at The Neurocritic. Basically the authors took some women with a diagnosis of "Hypoactive Sexual Desire Disorder" (HSDD), and some normal women, put them in an fMRI scanner and showed them porn. Different areas of the brain lit up.
Scans appear to show differences in brain functioning in women with persistently low sex drives, claim researchers.
So what? For starters we have no idea if these differences are real or not because the study only had a tiny 7 normal women, although strangely, it included a full 19 women with HSDD. Maybe they had difficulty finding women with healthy appetites in Detroit?
Either way, a study is only as big as its smallest group so this was tiny. We're also not told anything about the stats they used so for all we know they could have used the kind that give you "results" if you use them on a dead fish.
But let's grant that the results are valid. This doesn't tell us anything we didn't already know. We know the women differ in their sexual responses - because that's the whole point of the study. And we know that this must be something to do with their brain, because the brain is where sexual responses, and every other mental event, happen.
So we already know that HSDD "has a physical origin", but only in the sense that everything does; being a Democrat or a Republican has a physical origin; being Christian or Muslim has a physical origin; speaking French as opposed to English has a physical origin; etc. etc. None of which is interesting or surprising in the slightest.
The point is that the fact that something is physical doesn't stop it being also psychological. Because psychology happens in the brain. Suppose you see a massive bear roaring and charging towards you, and as a result, you feel scared. The fear has a physical basis, and plenty of physical correlates like raised blood pressure, adrenaline release, etc.
But if someone asks "Why are you scared?", you would answer "Because there's a bear about to eat us", and you'd be right. Someone who came along and said, no, your anxiety is purely physical - I can measure all these physiological differences between you and a normal person - would be an idiot (and eaten).
Now sometimes anxiety is "purely physical" i.e. if you have a seizure which affects certain parts of the temporal lobe, you may experience panic and anxiety as a direct result of the abnormal brain activity. In that case the fear has a physiological cause, as well as a physiological basis.
Maybe "HSDD" has a physiological cause. I'm sure it sometimes does; it would be very weird if it didn't in some cases because physiology can cause all kinds of problems. But fMRI scans don't tell us anything about that.
Link: I've written about HSDD before in the context of flibanserin, a drug which was supposed to treat it (but didn't). Also, as always, British humour website The Daily Mash hit this one on the head...
Posted in
bad neuroscience,
flibanserin,
fMRI,
media,
mental health,
neurofetish,
woo
Sex and Money on the Brain
06.00
wsn
 Back in 1991, Mark Knopfler sang
"Sex and money are my major kicksNow twenty years later a team of French neuroscientists have followed up on this observation with a neuroimaging study: The Architecture of Reward Value Coding in the Human Orbitofrontal Cortex.
Get me in a fight I like the dirty tricks"
Sescousse et al note that people like erotic stimuli, i.e. porn, and they also like money. However, there's a difference: porn is, probably, a more "primitive" kind of rewarding stimulus, given that naked people have been around for as long as there have been people, whereas money is a recent invention.
The orbitofrontal cortex (OFC) is known to respond to all kinds of rewarding stimuli, but it's been suggested that the more primitive the reward, the more likely it is to activate the evolutionarily older posterior part of the OFC, whereas abstract stimuli, like money, activate more anterior parts of that area.
While this makes intuitive sense, it's never been directly tested. So Sescousse et al took 18 heterosexual guys, put them in an fMRI scanner, showed them porn, and gave them money. Specifically:
Two categories (high and low intensity) of erotic pictures and monetary gains were used. Nudity being the main criteria driving the reward value of erotic stimuli, we separated them into a “low intensity” group displaying women in underwear or bathing suits and a “high intensity” group displaying naked women in an inviting posture. Each erotic picture was presented only once to avoid habituation. A similar element of surprise was introduced for the monetary rewards by randomly varying the amounts at stake: the low amounts were €1-3 and the high amounts were €10-12.You've gotta love neuroscience. Although the authors declined to provide any samples of the stimuli used.
 Anyway, what happened?
As hypothesized, monetary rewards specifically recruited the anterior lateral OFC ... In contrast, erotic rewards elicited activity specifically in the posterior part of the lateral OFC straddling [fnaar fnaar] the posterior and lateral orbital gyri. These results demonstrate a double dissociation between monetary/erotic rewards and the anterior/posterior OFC ... Among erotic-specific areas, a large cluster was also present in the medial OFC, encompassing the medial orbital gyrus, the straight [how appropriate] gyrus, and the most ventral part of the superior frontal gyrus. [immature emphasis mine]In other words, the posterior-primitive, anterior-abstract relationship did seem to hold, at least if you accept that money is more abstract than porn. (Many other areas were activated by both kinds of rewards, such as the ventral striatum, but these were less interesting as they've been identified in many previous studies.)
Overall, this is a good study, and a nice example of hypothesis-testing using fMRI, which is to be preferred to just putting people in a scanner and seeing which parts of the brain light up in a purely exploratory manner...
You're (Brain Is) So Immature
06.30
wsn
How mature are you? Have you ever wanted to find out, with a 5 minute brain scan? Of course you have. And now you can, thanks to a new Science paper, Prediction of Individual Brain Maturity Using fMRI. This is another clever application of the support vector machine (SVM) method, which I've written about previously, most recently regarding "the brain scan to diagnose autism". An SVM is a machine learning algorithm: give it a bunch of data, and it'll find patterns in it.
In this case, the input data was brain scans from children, teenagers and adults, and the corresponding ages of each brain. The pattern the SVM was asked to find was the relationship between age and some complex set of parameters about the brain.
The scan was resting state functional connectivity fMRI. This measures the degree to which different areas of the brain tend to activate or deactivate together while you're just lying there (hence "resting"). A high connectivity between two regions means that they're probably "talking to each other", although not necessarily directly.
It worked fairly well: Out of 238 people aged 7 to 30, the SVM was able to "predict" age pretty nicely on the basis of the resting state scan. This graph shows chronological age against predicted brain age (or "fcMI" as they call it). The correlation is strong: r2=0.55.
The authors then tested it on two other large datasets: one was resting state, but conducted on a less powerful scanner (1.5T vs 3.0T) (n=195), and the other was not designed as a resting state scan at all, but did happen to include some resting state-like data (n=186). Despite the fact that these data were, therefore, very different to the original dataset, the SVM was able to predict age with r2 over 0.5 as well.
What use would this be? Well, good question. It would be all too easy to, say, find a scan of your colleague's brain, run it through the Mature-O-Meter, and announce with glee that they have a neurological age of 12, which explains a lot. For example.
However, while this would be funny, it wouldn't necessarily tell you anything about them. We already know everyone's neurological age. It's... their age. Your brain is an old as you are. These data raise the interesting possibility that people with a higher Maturity Index, for their age, are actually more "mature" people, whatever that means. But that might not be true at all. We'll have to wait and see.
How does this help us to understand the brain? An SVM is an incredibly powerful mathematical tool for detecting non-linear correlations in complex data. But just running an SVM on some data doesn't mean we've learned anything: only the SVM has. It's a machine learning algorithm, that's what it does. There's a risk that we'll get "science without understanding" as I've written a while back.
In fact the authors did make a start on this and the results were pretty neat. They found that as the brain matures, long-range functional connections within the brain become stronger, but short-range interactions between neighbours get weaker and this local disconnection with age is the most reliable change.
 You can see this on the pic above: long connections get stronger (orange) while short ones get weaker (green), in general. This is true all across the brain.
It's like how when you're a kid, you play with the kids next door, but when you grow up you spend all your time on the internet talking to people thousands of miles away, and never speak to your neighbours. Kind of.
Link: Also blogged about here.
Posted in
fMRI,
methods,
neurofetish,
papers
fMRI Analysis in 1000 Words
04.45
wsn
Following on from fMRI in 1000 words, which seemed to go down well, here's the next step: how to analyze the data.
There are many software packages available for fMRI analysis, such as FSL, SPM, AFNI, and BrainVoyager. The following principles, however, apply to most. The first step is pre-processing, which involves:
- Motion Correction aka Realignment – during the course of the experiment subjects often move their heads slightly; during realignment, all of the volumes are automatically adjusted to eliminate motion.
- Smoothing – all MRI signals contain some degree of random noise. During smoothing, the image of the whole brain is blurred. This tends to smooth out random fluctuations. The degree of smoothing is given by the “Full Width to Half Maximum” (FWHM) of the smoother. Between 5 and 8 mm is most common.
- Spatial Normalization aka Warping – Everyone’s brain has a unique shape and size. In order to compare activations between two or more people, you need to eliminate these differences. Each subject’s brain is warped so that it fits with a standard template (the Montreal Neurological Institute or MNI template is most popular.)
Then the real fun begins: the stats. By far the most common statistical approach for detecting task-related neural activation is that based upon the General Linear Model (GLM), though there are alternatives.
We first need to define a model of what responses we’re looking for, which makes predictions as to what the neural signal should look like. The simplest model would be that the brain is more active at certain times, say, when a picture is on the screen. So our model would be simply a record of when the stimulus was on the screen. This is called a "boxcar" function (guess why):
 In fact, we know that the neural response has a certain time lag. So we can improve our model by adding the canonical (meaning “standard”) haemodynamic response function (HRF).
 Now consider a single voxel. The MRI signal in this voxel (the brightness) varies over time. If there were no particular neural activation in this area, we’d expect the variation to be purely noise:
 Now suppose that this voxel was responding to a stimulus present from time-point 40 to 80.
While the signal is on average higher during this period of activation, there’s still a lot of noise, so the data doesn’t fit with the model exactly.
 The GLM is a way of asking, for each voxel, how closely it fits a particular model. It estimates a parameter, β, representing the “goodness-of-fit” of the model at that voxel, relative to noise. Higher β, better fit. Note that a model could be more complex than the one above. For example, we could have two kinds of pictures, Faces and Houses, presented on the screen at different times:
 In this case, we are estimating two β scores for each voxel, β-faces and β-houses. Each stimulus type is called an explanatory variable (EV). But how do we decide which β scores are high enough to qualify as “activations”? Just by chance, some voxels which contain pure noise will have quite high β scores (even a stopped clock’s right twice per day!)
The answer is to calculate the t score, which for each voxel is β / standard deviation of β across the whole brain. The higher the t score, the more unlikely it is that the model would fit that well by chance alone. It’s conventional to finally convert the t score into the closely-related z score.
We therefore end up with a map of the brain in terms of z. z is a statistical parameter, so fMRI analysis is a form of statistical parametric mapping (even if you don’t use the "SPM" software!) Higher z scores mean more likely activation.
Note also that we are often interested in the difference or contrast between two EVs. For example, we might be interested in areas that respond to Faces more than Houses. In this case, rather than comparing β scores to zero, we compare them to each other – but we still end up with a z score. In fact, even an analysis with just one EV is still a contrast: it’s a contrast between the EV, and an “implicit baseline”, which is that nothing happens.
Now we still need to decide how high of a z score we consider “high enough”, in other words we need to set a threshold. We could use conventional criteria for significance: p less than 0.05. But there are 10,000 voxels in a typical fMRI scan, so that would leave us with 500 false positives.
We could go for a p value 10,000 times smaller, but that would be too conservative. Luckily, real brain activations tend to happen in clusters of connected voxels, especially when you’ve smoothed the data, and clusters are unlikely to occur due to chance. So the solution is to threshold clusters, not voxels.
A typical threshold would be “z greater than 2.3, p less than 0.05”, meaning that you're searching for clusters of voxels, all of which has a z score of at least 2.3, where there's only a 5% chance of finding a cluster that size by chance (based on this theory.) This is called a cluster corrected analysis. Not everyone uses cluster correction, but they should. This is what happens if you don't.
Thus, after all that, we hopefully get some nice colorful blobs for each subject, each blob representing a cluster and colour representing voxel z scores:
 This is called a first-level, or single-subject, analysis. Comparing the activations across multiple subjects is called the second-level or group-level analysis, and it relies on similar principles to find clusters which significantly activate across most people.
This discussion has focused on the most common method of model-based detection of activations. There are other "data driven" or "model free" approaches, such as this. There are also ways of analyzing fMRI data to find connections and patterns rather than just activations. But that's another story...
Posted in
bad neuroscience,
fMRI,
methods

